Using Graphic Design to Communicate New Drug Therapies
Patients making treatment decisions require easy-to-comprehend information. As the complexity of modern medicine increases, so does the challenge of conveying intricate scientific concepts to diverse audiences. Graphics have emerged as a powerful tool in bridging this communication gap, offering a visual language that can transcend barriers of technical jargon and enhance understanding across various stakeholders.
The Challenges of Communicating New Drug Therapies
The communication of new drug therapies faces several hurdles. First and foremost is the inherent complexity of pharmacological mechanisms. Modern drugs often interact with multiple biological pathways, targeting specific molecular structures in intricate cascades of effects. Explaining these processes in text alone can be daunting, often resulting in information overload or oversimplification.
Moreover, the audience for such communication is diverse, ranging from research scientists and clinicians to patients and regulatory bodies. Each group has different levels of scientific literacy and information needs. Researchers may require detailed molecular interactions, while patients need clear, actionable information about efficacy and side effects.
In our digital age, the challenge of information overload further complicates effective communication. With the constant influx of new studies, clinical trial results, and health information, cutting through the noise to deliver clear, impactful messages about new drug therapies is more crucial than ever.[1]
Types of Graphic Design for Drug Communication
To address these challenges, various types of graphics have been developed:
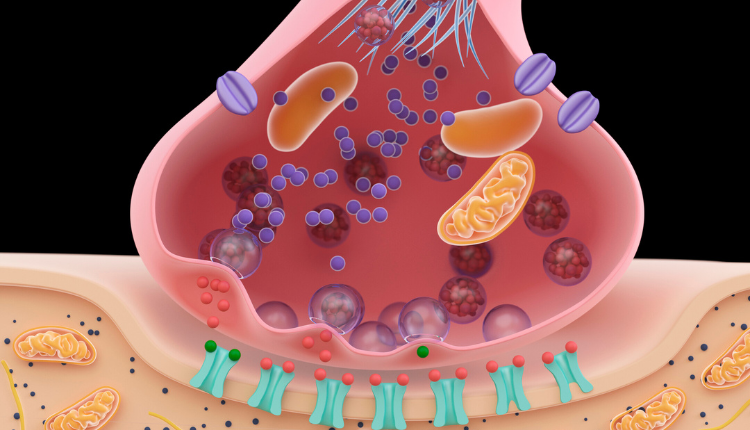
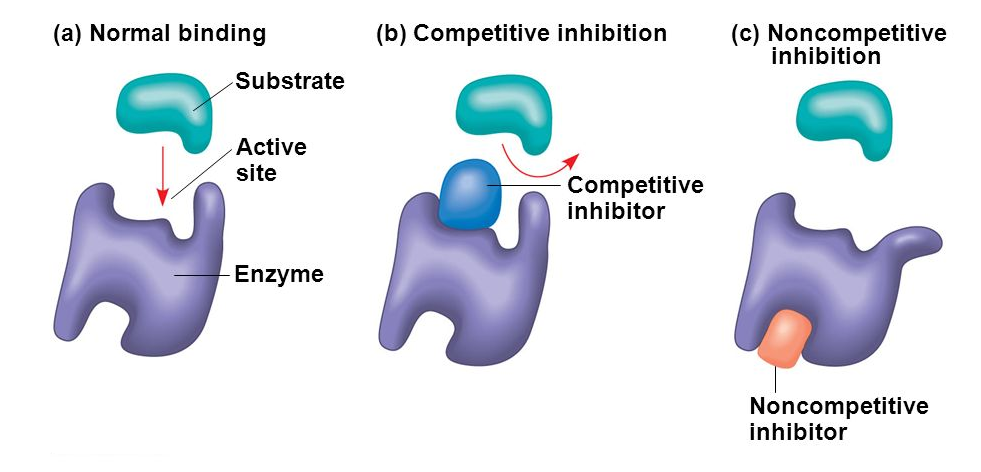
1. Molecular structures and interactions: These visualizations depict the physical structure of drug molecules and their binding sites, helping to illustrate the fundamental mechanisms of drug action.
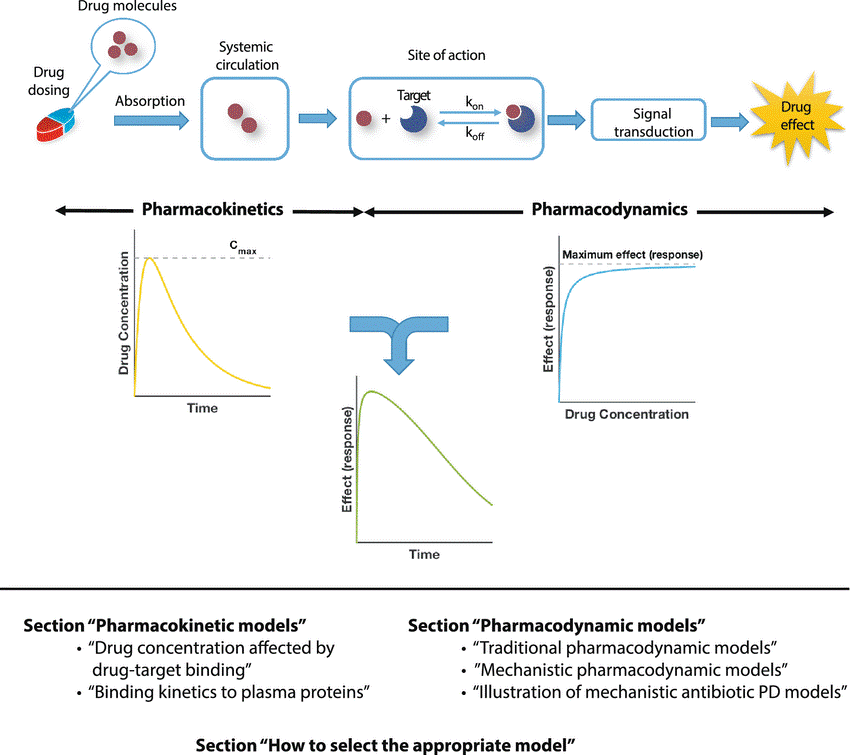
2. Pharmacokinetic/Pharmacodynamic (PK/PD) models: These graphics show how drugs are absorbed, distributed, metabolized, and excreted by the body over time, as well as their effects on target systems.[2]
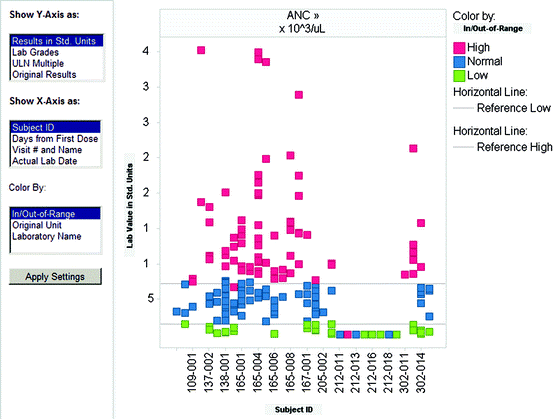
3. Clinical trial data visualizations: From forest plots to survival curves, these graphics summarize complex statistical data from clinical trials, making it easier to compare efficacy across different treatments or patient subgroups.[3]
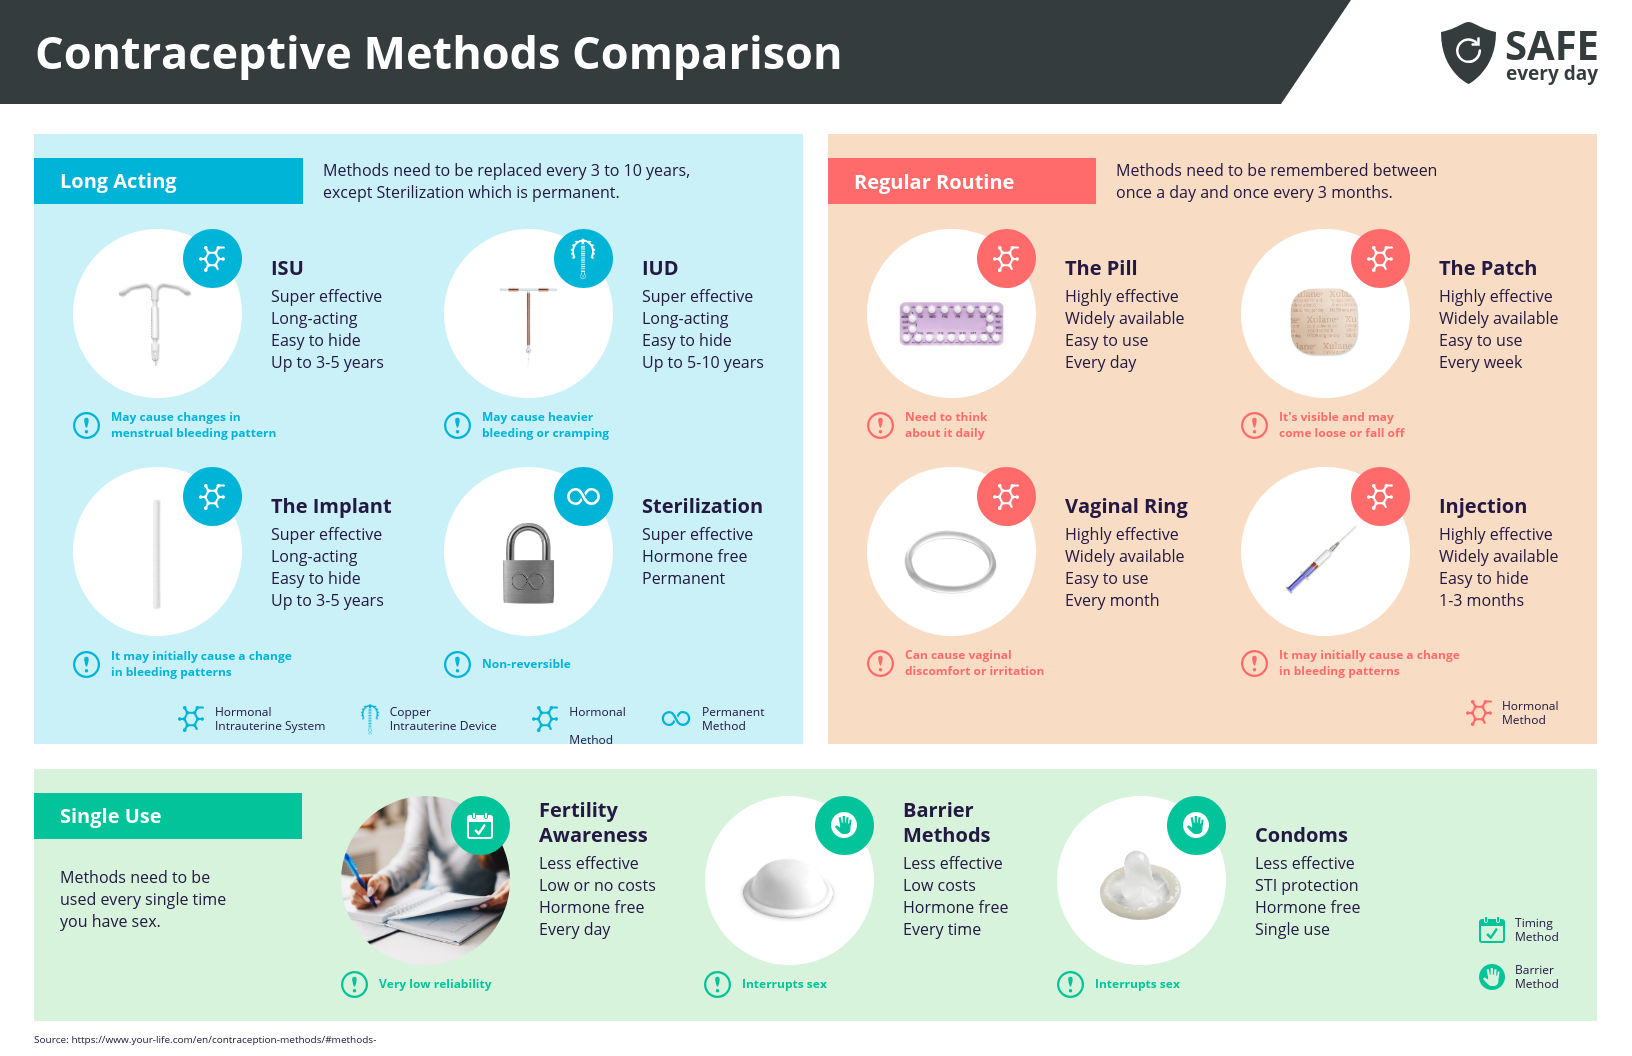
4. Patient-friendly infographics: These simplify complex medical information into easily digestible visual formats, often combining icons, charts, and minimal text to convey key points about drug administration, benefits, and potential side effects.
Ethical Considerations
The power of graphics in shaping understanding brings with it ethical responsibilities:
- Avoiding misleading representations: Care must be taken to ensure that graphical representations do not overstate efficacy or underplay risks. Scale manipulation, cherry-picking data, and other forms of visual rhetoric can easily lead to misinterpretation.
- Transparency in data presentation: It’s crucial to clearly indicate the source of data, sample sizes, and any limitations or uncertainties in the information presented.
- Cultural sensitivity: As drug development and marketing become increasingly global, graphics must be designed with cultural differences in mind. Symbols, colors, and even the direction of reading can vary across cultures, potentially affecting interpretation.
The role of graphics in communicating new drug therapies is evolving rapidly, driven by advances in both scientific understanding and technological capabilities. As we move forward, the challenge will be to harness these new tools while maintaining a steadfast commitment to clarity, accuracy, and ethical communication. By doing so, we can ensure that the incredible advances in drug development are matched by equally impressive strides in how we communicate these breakthroughs to the world.
Please contact us at services@ls.enago.com for any graphic design assistance!
References:
1- https://www.ncbi.nlm.nih.gov/books/NBK9571/
3- https://link.springer.com/chapter/10.1007/978-1-4614-5329-1_19
Author

Uttkarsha Bhosale
Executive Editor, Enago Academy
Medical Writer, Enago Life Sciences
Connect with Uttkarsha on LinkedIn